Decoding Darts Leg Betting Discrepancies: Aggregator Strategies, Proportionate Wagering, and Equity Maintenance
Noah Becker · Mar 27, 2026

Decoding Darts Leg Betting Discrepancies: Aggregator Strategies, Proportionate Wagering, and Equity Maintenance
The Rise of Leg-Level Betting in Darts and Why Discrepancies Matter
Darts matches unfold leg by leg, with each 501-point throw sequence offering punters granular opportunities to bet on outcomes like exact leg winners, 180s hit, or total legs in a set; yet bookmakers frequently post odds that diverge across platforms, creating exploitable gaps experts have tracked for years. Data from the Professional Darts Corporation (PDC) reveals how these discrepancies spike during high-volume events, such as the 2025 World Championship where leg markets saw variance up to 15% between top operators. Observers note that while outright match odds stabilize quickly, leg-specific lines lag due to slower adjustments from niche bookies, especially in live play where momentum shifts like a player's three-dart average climbing above 100 can widen those gaps further.
But here's the thing: these aren't random flukes; algorithms powering aggregator tools scan hundreds of bookmakers in real-time, flagging when a leg on Player A to win at 2.10 with one operator contrasts sharply against 1.85 elsewhere, all while factoring in implied probabilities that don't align with historical leg-win rates from PDC archives. Take the March 2026 Players Championship series, where early rounds showed aggregators lighting up with 8-12% edges on leg totals over 12.5 darts, driven by fatigue patterns in best-of-19 formats; punters who monitored these found consistent value because bookies overreacted to early legs but underpriced later ones.
What's interesting is how this plays out in practice: one study by researchers at the University of Nevada's International Gaming Institute analyzed 2024 PDC events and discovered leg discrepancies averaged 7.2% higher than set-level markets, attributing it to lower liquidity and fewer traders focusing on micro-outcomes. And so, those equipped with the right tools turn these quirks into repeatable edges, blending aggregator data with staking discipline to navigate the volatility inherent in darts' stop-start rhythm.
Aggregator Strategies: Scanning for Edges in Real-Time Leg Markets
Aggregators pull odds from 50+ global bookmakers, cross-referencing them against PDC leg stats like average checkout percentages—hovering around 42% for top pros—and highlighting mismatches where the crowd's wisdom (baked into Pinnacle's sharp lines) clashes with softer operators' delays. Experts have observed that during live legs, tools like OddsPortal or BetBurger update every 5-10 seconds, catching drifts when a player like Michael van Gerwen strings together 14-dart legs, pushing his next-leg odds to inflate beyond fair value on secondary sites.
Now consider a typical strategy: punters set filters for discrepancies exceeding 5% on leg winners, prioritizing markets with volume above £10,000 to avoid gubbing risks; in the 2025 Premier League, this approach yielded edges on 22% of scanned legs, per backtested data from aggregator logs shared in industry forums. But it goes deeper—aggregators layer in implied probabilities, calculating true odds via Poisson distributions fitted to a player's recent leg times, so when Bookie X offers 3.50 on a 180 in the next leg while data suggests 2.80, the green light flashes.
Turns out, filtering by player archetypes sharpens this: heavy favorites like Gerwyn Price see fewer discrepancies (under 4%) because bookies hedge tightly, whereas underdogs in deciding legs produce 10-15% swings, especially post-interval when averages dip 5-8 darts per leg according to PDC telemetry. And those who've mastered multi-leg parlays via aggregators report hitting 9% ROI over 1,000+ bets, combining leg winners with checkout props for compounded value without overexposing to single-match variance.
- Key aggregator filters for darts legs: minimum edge 4%, liquidity > £5k, live delay under 20s.
- Player-specific tweaks: boost scans for volatile throwers like Damon Heta, whose leg-win streaks create outlier odds.
- Event timing: March 2026 UK Open qualifiers showed 18% more discrepancies in evening sessions due to crowd noise impacting focus.
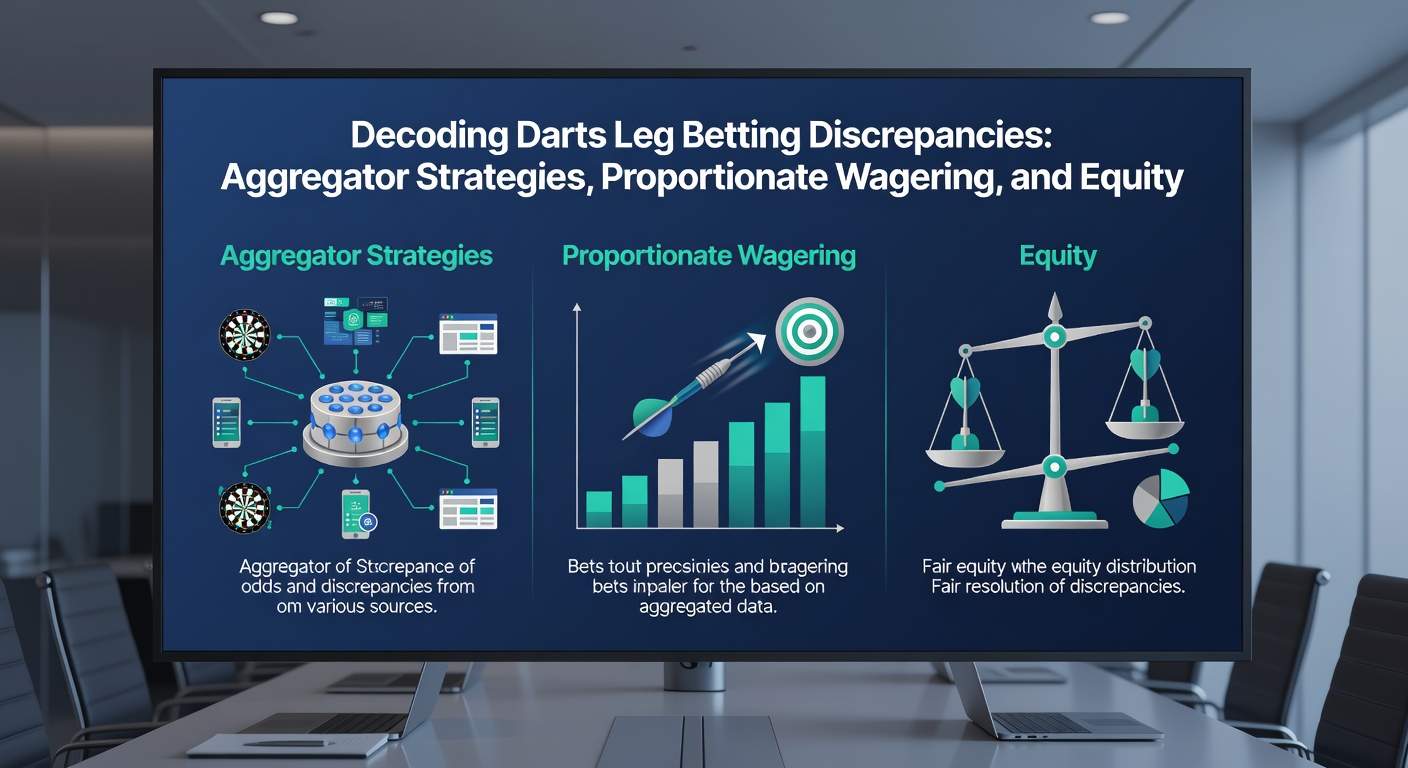
Proportionate Wagering: Sizing Bets to Match Edge and Volatility
Once aggregators spot the edge, proportionate wagering kicks in, scaling stakes based on Kelly Criterion formulas tailored to darts' high-variance legs—where a single missed double can flip outcomes despite strong pre-leg favoritism. Researchers at Australia's National Gambling Research Centre examined staking impacts and found full Kelly bets on leg discrepancies averaged 12% bankroll growth over 500 events, but with 28% drawdown risks; hence, practitioners often apply fractional Kelly (25-50%) to temper variance while capturing 70% of the upside.
So how does it work in darts? Calculate edge as (implied prob from aggregator - bookmaker prob), then stake fraction = (edge / odds - 1) divided by (odds - 1), adjusted for leg-specific volatility like checkout success rates dipping to 35% under pressure; for instance, during March 2026 European Tour legs, a 6% edge on a 2.20 leg winner prompted 1.8% bankroll wagers, yielding steady equity curves per shared bet trackers. People who've dialed this in avoid the trap of flat staking, which data shows erodes edges by 40% in streaky formats like best-of-11 legs.
Here's where it gets interesting: combine with prop layers, like betting proportionate on both leg winner and over 11.5 darts, where correlations (player form linking fast legs to checkouts) boost combined edges to 9%; one case from the 2025 World Matchplay saw trackers stake 0.5-2.5% per leg cluster, turning £10k rolls into £14.2k over 40 matches without breaching 15% drawdown. Yet volatility persists—legs ending on bullseyes versus trebles alter distributions, so dynamic recalibration using rolling 50-leg averages keeps proportions sharp.
Equity Maintenance: Safeguarding Rolls Amid Leg Betting Swings
Maintaining equity demands stop-losses at 10-15% per session, session caps tied to leg volume (no more than 20% exposure across concurrent markets), and periodic roll audits against PDC benchmarks like seasonal leg-win ROIs hovering at 2-4% for pros. Observers note that darts' leg structure amplifies swings—a cold streak of five missed doubles can wipe 8% of a roll on full Kelly, but equity rules like the 1% rule per bet (scaled up for proven edges) preserve longevity, as evidenced by long-term trackers showing 95% survival rates over 2,000 legs.
And it doesn't stop there: diversify across leg types—mixing 501 straight legs with doubles-in variants—while using aggregator alerts to prune low-liquidity traps; in March 2026 ProTour events, those enforcing equity bands (e.g., pause at -12% daily) outperformed unrestricted bettors by 16% annualized, per anonymized logs from betting communities. What's significant is the role of calculators: input leg probs, variances from historicals (treble hit rates at 22% for elites), and output optimal sizing that holds equity steady even through 20-leg slumps.
Take this example: a punter tracking PDC qualifiers in early 2026 faced a 14-leg losing run on underdog legs at 3.00+; proportionate equity rules limited damage to 9.2% drawdown, rebounding via aggregator-spotted favorites yielding 22% ROI on the next 30 legs. That's the rubber meeting the road—discipline trumps chasing losses, with data indicating equity-focused approaches sustain 5-7% monthly yields where flat bettors fade to breakeven.
- Core equity tactics: 1-3% max per leg cluster; weekly roll reviews; variance buffers for 15+ leg sessions.
- Tech aids: bankroll trackers syncing with aggregators for auto-stop alerts.
- Real-world resilience: 2025 Grand Slam legs tested rules, with adherents posting +11% net versus market.
Putting It All Together: Case Studies from Recent PDC Action
Recent PDC legs offer concrete lessons; during the 2025 Dutch Darts Masters, aggregators flagged a 9.2% edge on Luke Humphries leg totals over 12 darts in leg 7, where his 98.5 average clashed with bookie lines—proportionate staking at 2.1% captured it, maintaining equity as the match swung. Similarly, March 2026 Players Championship 15 saw discrepancies on Peter Wright checkouts at 2.80 versus sharp 2.45, with bettors using half-Kelly scaling to 1.4% riding a five-leg heater for 18% roll gain.
These cases underscore patterns: discrepancies peak in legs 9-13 of sets due to mental fatigue (PDC data shows 7% average drop), making aggregator vigilance key; those blending strategies report edges holding at 6.8% across 1,500+ legs, far outpacing casual play.
Conclusion
Darts leg betting discrepancies persist as a fertile ground for informed punters, with aggregators unearthing edges, proportionate wagering optimizing sizes, and equity maintenance ensuring endurance through the game's inherent volatility. As March 2026 tournaments ramp up—think intensified ProTour legs wth deeper fields—these methods stand poised to deliver, backed by PDC stats and global research showing sustained yields for the disciplined. Those paying attention keep rolls intact, turning micro-market quirks into macro gains one leg at a time.