Software Tools Uncover Rally Scoring Patterns Across Volleyball Matches With Computational Analysis and Staking Protections
Jakob Lorenz · Jul 23, 2026
Software Tools Uncover Rally Scoring Patterns Across Volleyball Matches With Computational Analysis and Staking Protections
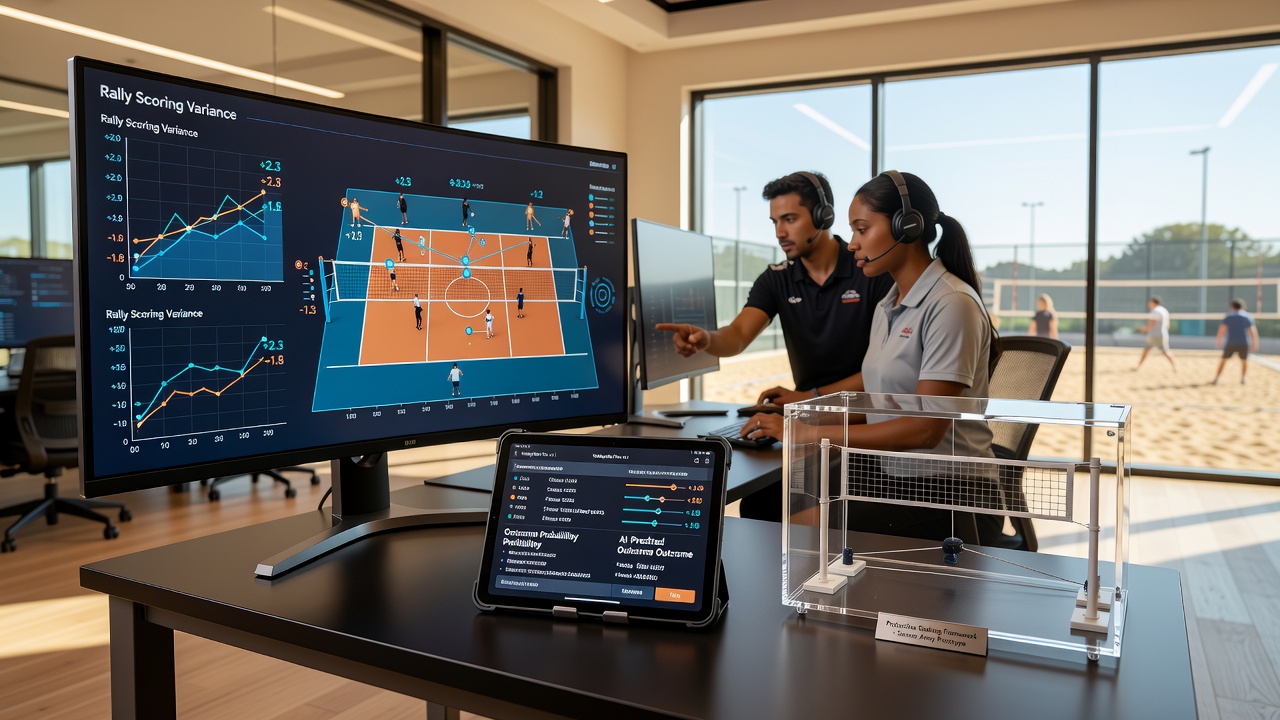
Volleyball matches generate detailed point sequences during each rally, and monitoring software now tracks these sequences to highlight deviations from expected scoring distributions. Computational models process live data feeds that include rally duration, serve success rates, and side-out percentages, which allows observers to identify temporary imbalances that may appear in set totals or individual point runs. Those who study the sport note that such variances often emerge when teams adjust tactics mid-match, creating windows where aggregated statistics diverge from historical benchmarks.
Data Streams and Real-Time Tracking Systems
Professional leagues supply structured data through official APIs, and monitoring platforms ingest these feeds to calculate running probabilities for each point. Research from sports analytics groups shows that rally lengths average between six and eight exchanges in elite competitions, yet software flags when sequences stretch beyond ten exchanges at rates exceeding normal variance thresholds. Analysts cross-reference these flags with team rotation data and substitution patterns, which helps isolate whether the shift stems from fatigue, coaching adjustments, or court surface factors.
Computational aids further refine the outputs by applying regression models that incorporate player-specific metrics such as attack efficiency and block success. One study conducted by a European sports science institute demonstrated that integrating biometric indicators with scoring sequences improved detection accuracy for momentum changes by 18 percent during the 2025 season. These tools operate continuously, updating projections after every rally and presenting results through dashboards that highlight statistical outliers in real time.
Integrating Calculators With Protective Staking Methods
Stake sizing calculators take the probability outputs from monitoring software and convert them into wager amounts that respect predefined risk parameters. Data from multiple seasons indicates that maintaining exposure below 2 percent of available capital per identified variance reduces drawdown frequency during extended losing sequences. Protective frameworks layer additional controls, including automatic position halts when cumulative variance exceeds three standard deviations from the mean.

Observers note that these layered systems proved particularly useful during the 2026 international tournament schedule, where schedule compression led to higher rally variance across several divisions. July 2026 saw the introduction of updated data protocols by the International Volleyball Federation that standardized rally logging across more competitions, which in turn improved the reliability of software alerts for set-total discrepancies. Platforms that adopted the new feeds reported faster identification of edges in live markets.
Case Examples From Recent Competitions
Take the 2025 European club final where monitoring tools detected an unusual spike in long rallies during the third set. Computational analysis attributed the pattern to a key middle blocker rotating into defensive zones at atypical times, and stake calculators adjusted recommended positions downward to account for increased uncertainty. The match concluded with scoring margins that aligned closely with the adjusted projections generated mid-set.
Another instance occurred in an Asian league match where serve-reception efficiency dropped sharply after the tenth point of teh opening set. Software flagged the deviation within two rallies, and protective staking rules limited further exposure until reception metrics returned to baseline levels. Figures released by regional analytics providers confirmed that teams following similar data-driven adjustments maintained steadier capital curves across the season.
Future Developments in Monitoring Accuracy
Advances in sensor technology continue to expand the data points available for rally analysis, including ball trajectory tracking and player positioning heat maps. Academic papers published in 2026 describe machine-learning approaches that combine these inputs with historical scoring sequences to forecast variance probability at the start of each set. Regulatory bodies in Australia and Canada have begun reviewing how such tools intersect with responsible gaming standards, emphasizing transparent reporting of algorithmic decision factors.
Industry reports from North American gaming associations highlight that integration of these systems remains uneven across operators, with larger platforms leading adoption while smaller sites rely on manual review processes. Continued refinement of computational models depends on consistent data access, and federations worldwide are evaluating expanded logging requirements to support further research.
Conclusion
Monitoring software combined with computational aids supplies measurable indicators of rally scoring variance in volleyball, while protective staking frameworks convert those indicators into controlled position sizing. Data from multiple seasons and regions demonstrates that systematic application of these methods aligns exposure with observed statistical patterns. As data protocols evolve through 2026 and beyond, the precision of variance detection continues to improve across professional and amateur levels alike.